Inspired by a student project a few years ago, I started investigating the voting patterns of the Eurovision song contest. Here is something I wrote just after the 2014 Eurovision Song Contest.
Once again, we have just had the fun and games that goes alongside the Eurovision Song Contest. An institution started in the 1950’s; it has witnessed the effects of much social and political change.
Year on year, commentators note particular voting patterns [Greece and Cyprus exchanging 12 points if both have made it to the finals], becoming increasingly cynical about the nature of the competition. It is of some interest to discover if it is possible to break through these perceived cliques: will a good enough song win the Eurovision, or do some countries have almost no hope?
To provide some supporting evidence of this clique like behaviour, voting records were obtained from the official Eurovision song contest website. To simplify the analysis presented here, only results from the finals (so excluding semi-finals) will be presented. As the voting procedure has changed several times in the history of the contest, the years 2009-2013 were selected. These years all had semi-final contests to decide which countries precede into the final, and scores were allocated based on an equal weighting of viewer telephone votes and a national judging panel.
The Business of Voting
The procedure for allocation votes have changed multiple times since the conception of Eurovision; notably in 1998 when mass televoting was introduced (only countries without a properly functioning telephone network were permitted to retain the jury system) and in 2009 this was changed to give an equal weighting to audience and jury votes. In 1997 a relegation system based on the performance in the previous five years was introduced, to be replaced with a semi-final in 2004. In 2008 the current system of two semi-finals was introduced. Throughout all the change in the last twenty years, one thing has remained constant: the votes themselves (1, 2, 3, 4, 5, 6, 8, 10 and 12 points) that can be given to any other country in the final, which was introduced in 1975. [i]
Basic information about the split between televoting and jury decisions are released after the event, but these are not broken down by country. Due to the changes in the voting regulations, it is of interest to see if any perceived voting alliances persist within the current voting system, other than the traditional exchange (where possible) of twelve points between Greece and Cyprus.
Social Networks
With the pervasiveness of social media online, the concept of a social network has become familiar to many; to clarify here we use the idea that a social network is “a system of social interactions and relationships”.[ii] Social network analysis has become a way for people to explore how connected their networks of facebook friends are; how quickly trending topics spread on twitter and how to track down culpable groups based on the meta data (not the content) of email exchanges amongst many other (some are even useful) usages of the analysis of social networks.
The simplest form of social network is that like a friendship network on facebook, as represented by Figure 1. In this network, I am directly connected to nodes labelled Paul, Jane and Liz. Nodes Jane and Liz are connected to one another, but not directly connected to node Paul. Nodes Jo and Bob are indirectly connected to me through Paul. In this basic setup, the connections between the nodes allow for travel in both directions – as friendship is a shared experience.

Figure 1: Basic social network
Suppose, instead, that this network represented email traffic, the arrows represent who sent the email and who was at the receiving end of emails.
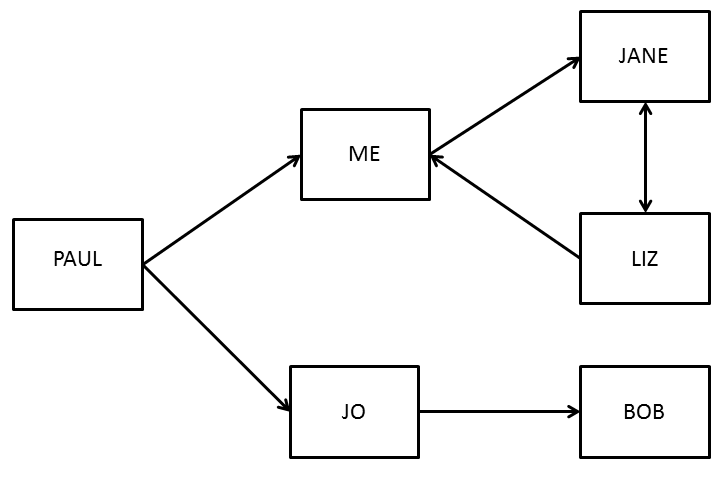
Figure 2: A directed social network
Figure 2 is of the same basic structure as Figure 1, but this time information only flows in the direction of the arrows. So Paul sends me and Jo an email. Jo forwards the email onto Bob. I forward the email to Jane, who enters into an email exchange with Liz who then responses to me. Without creating additional connections there is no direct path from Bob to Liz at present. This explains the basic difference between directed and undirected networks.
Finally, before looking at the Eurovision data, we should think about weighted social networks. You could imagine a weighting being given based on the number of emails exchanged between people in the network. Figure 2 represents a situation where every connection has equal weight, but this will not allow us to represent the difference between one country giving another a single point versus the all-important “douze points”.

Figure 3: A weighted, directed social network
In Figure 3, Paul begins the email chain with two emails to me and Jo. Both Jo and I send on one of those emails (not necessarily the same one) to Bob and Jane respectively. Jane and Liz then start a mini conversation about the email (Jane sending a total of three emails to Liz, Liz replies twice) and Liz then sends me a summary of their discussion. This is a basic example of what is called a weighted, directed social network, visualised as a graph.
Available Data
On the Eurovision website information on the voting records in the song contest finals are available from 1957 onwards. Due to all the changes in the voting process, we will examine the years 2009-2014. Forty-six different countries participated in the song contest in these six competitions; however Andorra and Czech Republic only voted once (in 2009) and have never made it into the final, so they were excluded from subsequent analysis as not containing sufficient information about ongoing voting patterns. Bulgaria, Latvia and Slovakia voted in five, six and four years, but have never qualified for the final in the years of interest (2009-2014).
Eurovision as a Social Network
Voting behaviour can be represented as a social network; each country has 10 votes to allocate (1, 2, 3, 4, 5, 6, 8, 10 and 12 points) to any other country with a song in the final. Votes are not always reciprocated. The votes cast in 2014 are shown in Figure 4. Arrows represent votes cast from one country to another, the shade indicates how strong a vote it is (darker colour being a higher vote, thus low votes are suppressed in this graph for clarity). All participating countries, even those who did not succeed in reaching the final, get to vote. Thus there are many countries that can cast votes but not receive any votes.

Figure 4: Representing the votes of 2014 as a social network
To moderate this problem, instead of looking at a single year we look at the average vote received by each of the countries from each of the other countries and model this as a social network. This is not as simple as adding up the total give from one country to another and dividing by number of years being examined, as we need to divide by the number of times the receiving country made it to the final of the competition in years that the giving country voted.
By examining the voting data in this way, the focus becomes on systematic behaviour rather than the behaviour in a specific year, which may be determined by the individual song.
An average vote of 0 given by country X to country Y indicates that country X never voted for country Y, while and average vote of 12 indicates that country X [Greece for example] always (where possible) gives 12 points to country Y [Cyprus]. This becomes a problem of analysing a weighted (votes have different points), directed (voting is not always reciprocated) network.
The analysis comprised at evaluating how closely connected the different countries were; solely on the basis of their voting history.

Figure 5: Three cluster solution
The three distinct voting clusters are clearly geographically based – with a clear cluster of former Yugoslavian countries, another under the influence of Russia, with the remaining cluster representing
[ii] http://www.oed.com/view/Entry/183739?redirectedFrom=social+network#eid139354802
