Posted in Uncategorized

Mastodon Advice

Creating an account

People say that it doesn’t matter what instance (aka server) you choose. They are wrong. Difference instances have different rules and different vibes.

Think of an instance as your local neighbourhood. While you may have friends around the world, you have to follow the rules that are based on where you are.

Pick an instance that:
1. Suits your moderation preferences
2. Matches your interests / location or is pretty generic
3. Is open for new accounts at the moment.

To help you find such an instance, I recommend people use https://instances.social/ (best viewed on a large screen browser rather than a mobile device) to search for one that fits their needs. Personally, avoiding the very large instances at the moment is probably a good idea, as they are most likely to be overwhelmed with moderation of a lot of new people unused to the culture.

When you have picked a server / instance to join, read up on it a little more, just to check. For example, I am on the https://mastodon.ie server; https://mastodon.ie/@mastodonie has some useful pinned posts that help explain the vibes of the server.

Sign-up messages for mastodon.ie get read by the admins, and we use them as a simple reassurance that someone is grand.
If you used dummy text, it was probably rejected, because the humans didn’t understand it.
One thing we’ve learned is that a lot of people thought it was just a bot thing, but it isn’t.

If you think something like that happened you, you can just apply again at: https://mastodon.ie/auth/sign_up

Sorry for any confusion.

(please pass on if you know someone)

https://mastodon.ie/@mastodonie/109522400216871086

Now you have joined a server: getting started

Sit back and observe just a little. Check to see if the server is what you expected. The easiest time to switch servers is when you have few followers / are following few people and you don’t have many posts, so use the time to figure out if you are where you want to be. Note that you can only switch servers once a month (or so), but you can hold accounts on multiple servers at once, especially if they serve difference purposes.

Start by following hashtags rather than just people. It can start diversifying who you follow. There isn’t an algorithm driving engagement with the feed and suggesting new people to follow, so it is more work than commercial social media sites, for whom commercial success depends on audience retention and engagement.

Boosts versus favourites

Favouriting a post does not increase its visibility. Instead it lets the author know that you have seen their post and like it. If you want others to see the posts, then boost them. You will only receive notifications about posts that you have made, not that you have boosted (other than a notification if the original author edits the post). Determining how many times a post has been interacted with is actually a bit tricky on mastodon, as not all interactions are visible – it will depend on federation status and lots more complicated things (not for this post!)

Different Feeds

You will typically have three different feeds. Your home feed is for accounts (or hashtags) that you follow; a second one (a group of people) is for accounts that are on the same server as you and then the global feed (for all accounts that your server is federated with). Federation is a thing in and of itself. I will give a short (missing all subtlety) version below

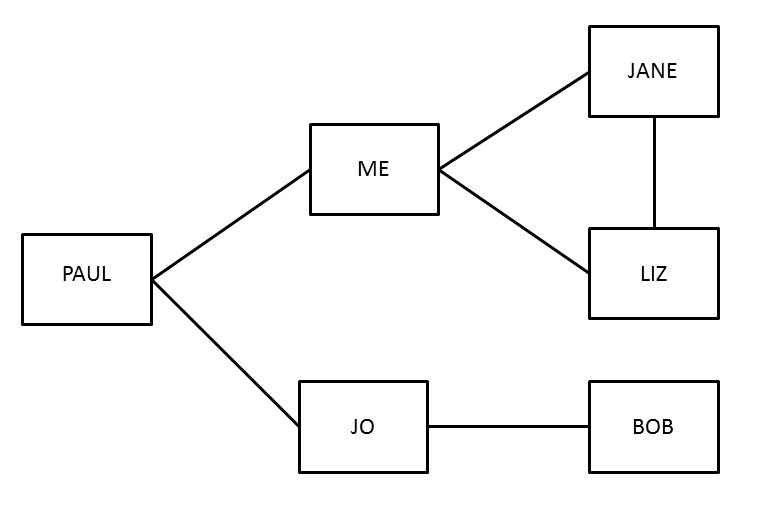
Two servers (A and B) can be linked when people from those servers follow accounts on the other server, allowing the servers to be visible to one another. However, if moderators of one of the servers (A) decide that the moderation policies of the other server (B) aren’t up to scratch, then they can choose to defederate from server B, so while you (on server A) can still follow accounts from server (B) and they can still appear in your home timeline, posts from this server won’t appear on your global feed.

Finding things: the hashtag

Text is not searchable on mastodon. To find an account, you need to know the full handle of the account: for example the username and the server. I am @dtoher@mastodon.ie or https://mastodon.ie/@dtoher

If you want others to find your posts by searching, you will need need to include relevant hashtags – such as #EJC or #juggling if I am talking about the European Juggling Convention, or #RStats when talking about R. To be polite to those using screenreaders, it is recommended to use either camelCase or PascalCase when combining words to form a single hashtag: so it would be #EuropeanJugglingConvention if using Pascal case! The screenreader can then tell when each word ends and it can be read more naturally.

More on accessibility

Using alt text for the images posted is more of a cultural norm on mastodon than on other social media sites I have used. However, many new users have not adopted this (which is a pity) and not all apps make it possible to read the alt text – this was one thing that recent versions of twitter got right!

Accessibility goes beyond physical barriers – it also includes gender, race and location barriers. At the moment, due, in part, to its European origins, mastodon is still very white and Eurocentric. Many servers ban TERFs and all forms of transphobic posting, which makes a nice difference from twitter.

Conflicts can arise due to different cultural expectations. This can mean that someone may be banned from a server for what may seem to be petty reasons (and may in fact be relatively petty) – with big waves of new users, moderation teams (usually volunteers) may be overwhelmed. Think before reporting –

Please consider the report button to mean “this person may need to be removed”. When you press the button, mods have to stop making the dinner until they know what’s happening and that nobody feels unsafe.

If someone needs guidance rather than removal, (CW, global vs unlisted, etc) maybe you can do it?

If you’d like to try, be friendly, be conversational, start by saying “Hello, how are you finding all this?” Let people know you have their back before making them self-conscious or defensive.

https://mastodon.ie/@mastodonie/109348667879690753

That being said, if someone is posting something in obvious breach of your servers rules, report it. If they are on your server, then your mod team will look at it and evaluate what to do. If it is on a different server, then, if the server you are on is linked (federated with) the process is a little more complex – but if it is in breech of the rules of their home server they may be banned; if it is not but your mod team still think that it is objectionable, then they may start the defederation process.

Do remember that you also have the choice to block individual accounts, and block terms. You also have the option to hide terms within a content wrapper/warning (CW) using the filtering system. I really like this; it essentially creates a spoiler for you.

The request for use of CW was a big point of conflict between different communities during the last twitter influx. In particular, many black people found being requested to put a CW on their posts insulting, especially posts discussing being racially harassed; saying that personal experiences shouldn’t need to be hidden. This was against the culture of “opt-in” consent that had built up and that existing users claimed that it allowed them to decide if they were in a suitable frame of mind to read posts that may be triggering.

Some of the requests to put things behind a CW were more innocuous – for example, I found that people putting food related posts behind a CW to be really helpful, as I have had eating related issues in the past. Other people thought that there was excessive amount of CW happening. Most people would never think to do this, so the new feature (arrived in November) to create text based CW filters can help this.

Therefore, at a minimum, put an appropriate hashtag on your post, so that people with that CW filter set up can have it activated. Forcing someone to listen to you without their consent doesn’t bring happiness, respecting personal boundaries is important.

Switching servers

There are lots of guides out there on how to switch servers. Danielle Navarro’s excellent blog post on mastodon is the best I have found on that (linked at bottom). The only bit missing is how to archive your posts on the old server. You may need to do a manual request for this – especially if you have posted more than 20 posts (as 20 posts is the number that comes up with your RSS feed – add rss to the end of your url to get the feed. https://mastodon.ie/@dtoher.rss will access my RSS feed. I have used the rtoot package to create a local archive of my posts. This means that I can set up an autodelete function (if I choose) which will help to minimise load on my server.

Support your server

Remember, this isn’t ad funded. Someone has to pay hosting costs. Check out how your server is funded. Toss a coin (if you can) to your admin team! Be friendly to other new arrivals – check out #introduction posts!

Apps

I have three mastodon accounts across two servers. I use the tusky app for two of those and the browser for the third. Mastodon works fine in a mobile browser, so you don’t have to pick an app to use it! Generally the official mastodon app isn’t great (on both Android and iOS) – other apps are nicer to use.

Further reading

In general https://blog.djnavarro.net/posts/2022-11-03_what-i-know-about-mastodon/ is the best guide I have found for using mastodon, including various optional settings that will make your user experience much better!

Posted in Uncategorized

Beyond passive consumers: engaging students more deeply with R packages

I have been thinking about how to engage students with R packages that may, at first, seem to make life incredibly easy for them, but which could make it more difficult for us to find assessment offenses.

The easystats family of packages is one such case.

Getting them to think about additional features is one such case. For example, in the report package having an option for variable names that are more nicely formatted than how they appear in the dataset would allow for the automated text output to be a lot more elegant and publication ready – even just using the classic iris dataset as an example.

For example: see the following example, as generated using quarto.

The ANOVA (formula: Sepal.Length ~ Species) suggests that:

  • The main effect of Species is statistically significant and large (F(2, 147) = 119.26, p < .001; Eta2 = 0.62, 95% CI [0.54, 1.00])

Effect sizes were labelled following Field’s (2013) recommendations.

using the lm command

model <- lm(Sepal.Length ~ Species, data = iris)
report.output<-report(model)

The automated reporting (stored in report.output) is as follows:

We fitted a linear model (estimated using OLS) to predict Sepal.Length with Species (formula: Sepal.Length ~ Species). The model explains a statistically significant and substantial proportion of variance (R2 = 0.62, F(2, 147) = 119.26, p < .001, adj. R2 = 0.61). The model’s intercept, corresponding to Species = setosa, is at 5.01 (95% CI [4.86, 5.15], t(147) = 68.76, p < .001). Within this model:

  • The effect of Species [versicolor] is statistically significant and positive (beta = 0.93, 95% CI [0.73, 1.13], t(147) = 9.03, p < .001; Std. beta = 1.12, 95% CI [0.88, 1.37])
  • The effect of Species [virginica] is statistically significant and positive (beta = 1.58, 95% CI [1.38, 1.79], t(147) = 15.37, p < .001; Std. beta = 1.91, 95% CI [1.66, 2.16])

Standardized parameters were obtained by fitting the model on a standardized version of the dataset. 95% Confidence Intervals (CIs) and p-values were computed using a Wald t-distribution approximation.

Even the option to be able to replace “Sepal.Length” with “Sepal Length” would really improve appearance of the resulting statements, as would being able to save the actual reference used [which was Andy Field’s 2013 textbook Discovering Statistics using IBM SPSS Statistics].

This would allow students to engage more deeply with package contents rather than be passive users. Perhaps an assessment in the form of a portfolio of suggested ideas (and implementations if possible) of features would be an interesting platform.

Even better, would be using peer assessment to help determine which of the suggested ideas would potentially be the most useful at their level of analysis.

Posted in Uncategorized

Tech for teaching online

A quick post to cover some of the technical issues associated the move to online teaching and marking.

Audio

I use an Audio-Technica 2020USB+ condenser microphone when at my desk.

IMG_20200620_180838184

In the class room, I previously have used a wireless microphone (with a USB receiver) when recording live content in rooms that I moved around a lot in.

Other audio options I have tried:

  • headset microphone – not great, records breathing!
  • microphone built into earphones, but dangling lower – better at not picking up breathing, but my one is a bit crackly.
  • a simple lapel microphone with a direct line in and a long cable – a good, inexpensive option for those looking for something that won’t take up too much space.

Webcam

Using a webcam built into a laptop means that you will have a horrible angle in most situations – think of all the people you see being interviewed from home!

I have a seperate webcam that can be positioned to my eyeline. This webcam also has document camera software (it is the HUE HD Pro USB document camera) which means that I can also use it as a visualiser and share the application with students for live tutorials.

IMG_20200620_180916253

Lighting when using a webcam

I have my desk set up right beside patio doors, so I have excellent natural light. However, there are some things you should think about here:

Natural light is your best lighting friend, so use it where possible. The nearer you can be to a window, the better.

Try to set up your space so it has a neutral but light background, with minimal things in the background to avoid distracting the viewer.

Avoid having big really dark items as the webcam tries to expose for these and then messes up all the rest of the lighting (for example, my curtains need to be out of shot or else everything else is over exposed. This tip was given to me during a video chat with a videographer, so I was able to have personalised recommendations for fine tuning my space.)

Try to avoid overhead light – it can create shine and shadows.

Have a small source of soft light to one side [if you have frosted rather than clear light bulbs it is helpful, if you don’t you could try a layer of tracing paper to create a softer effect – but you will lose some light]. I have a free standing lamp that has both an uplight and a side light. The side light is height adjustable, so I position that to come at the side of my face.

Harsher lights can be directed from the back (back lighting).

Bounce lights off bright surfaces (perhaps even a sheet hung up) to avoid a glare from direct lights.

Marking / Annotating documents

I use a small Wacom device (CTH-480S-ENES) that I have had for years. Note that the photo below has it on an A4 pad for scale. The pen doesn’t have a battery and is very comfortable to use.

IMG_20200620_180737979

The important thing to remember for this one is that you need to configure the device so that the aspect ratio is appropriate or all of your writing will be distorted.  A free solution for quick annotations is (surprisingly) the MS Edge browser.  Using this for quick annotations does not massively increase the size of the documents.


Posted in Uncategorized

I did a thing with the BBC

I’m a statistical ambassador – one of many at the Royal Statistical Society (I think that we are now on the third group).  Occasionally we get interesting requests. This one came in relatively recently.  Having more experience with the business end of things at festivals, I decided to volunteer for it.

Last year, I was part of a team that was based in Glastonbury during the festival, looking at the usage of generators on site.  I have also been involved in running juggling / circus festivals for many years.

While I did also do simulation based tests – looking at how long a random walk through an area would need to be, on average, before getting within a specific distance of a friend  (typically we used the limit of 2m) – given that your friends were also wandering around at random.

I looked at different size areas, including some trapezium shaped spaces (which would reflect the shape of a crowd in front of the stage).  These simulations all lead to less conservative estimates than using the negative binomial distribution lead to.  However, using the negative binomial distribution allows for a lot more situations to be investigated very quickly!

The negative binomial distribution is often used to model how many “successes” you observe before your “nth failure” – or vice versa (you just flip the probabilities).  As the team at the BBC were only interested in the duration of time to find the first friend, this simplifies the calculation somewhat. The resulting article is here.

The code / output below comes straight from the html file produced using Rmarkdown. Using Rmarkdown generated html files was a very easy way of sending the code and results back and forward, where people could access the results on pretty much any device!

I used cumulative sums as the negative binomial looks at the probability of finding your friend after seeing exactly that many people, rather than at less than or equal to that many people. The code below is also designed for situations with relatively dense, large crowds, where a person will only know a very small percentage of the total crowd; it is thus not suitable for modelling how long it would take me to find someone I know at a juggling convention, where the crowds are smaller, I know a large percentage of the overall crowd, and the total crowd is much smaller than at music festivals.

In saying that, it didn’t take me long to find people I knew at Glastonbury once I wandered towards the Theatre and Circus Field!

NegBinomialSearch1<-function(p,maxsteps=40000,maxdist=maxsteps/3,crowddensity=2){
  MaxFaces<-maxdist*4*(crowddensity/2)
  Nstrangers<-1:MaxFaces
  ret<-cumsum(p*((1-p)^Nstrangers))
  return(ret)
}

Initial parameters:

crowd.density<-2
MaxCrowd<-200000
p1<-(1:500)/MaxCrowd # know between 1 and 500 people, out of the total crowd
max.steps<-40000

Using a crowd density of 2 per m2, and a crowd size of 200000. Using integer numbers of friends from 1 to 500, this gives a minimum probability of 0.000005 and a maximum probability of 0.0025 of a particular person being a friend.

We have also set 40000 steps as being the maximum number of steps in a given day; which is then used in the function to calculate the expected number of faces that you may encounter (so the maximum number of “attempts”). Each day starts afresh, so is treated seperately – although, in practice, these would not be fully independent, as if you would be starting from similar points each day if camping!

MF<-floor(max.steps*4*(crowd.density/6)) # how many columns needed in the matrix
PfindingFriend<-matrix(NA,length(p1),MF)

for(i in seq_along(p1)){
  PfindingFriend[i,]<-NegBinomialSearch1(p1[i],maxsteps=max.steps,crowddensity=crowd.density)
}

Examination of the low probabilities – when you know up to 25 people in the crowd:

p1_1

Suppose:

p1_2.png

What percentage of the crowd do you need to know to have a 99% chance of spotting someone you know?

# P(finding a friend|know x% of population) = .99, what is minimum x
min(p1[apply(PfindingFriend,1,max)>.99])
## [1] 0.00009
# P(finding a friend|know x% of population) = .99, what is minimum z=x*200000
min(p1[apply(PfindingFriend,1,max)>.99])*MaxCrowd
## [1] 18

What percentage of the crowd do you need to know to have a 99.9% chance of spotting someone you know?

# P(finding a friend|know x% of population) = .999, what is minimum x
min(p1[apply(PfindingFriend,1,max)>.999])
## [1] 0.000135
# P(finding a friend|know x% of population) = .999, what is minimum z=x*MaxCrowd
min(p1[apply(PfindingFriend,1,max)>.999])*MaxCrowd
## [1] 27

What percentage of the crowd do you need to know to have a 80% chance of spotting someone you know?

# P(finding a friend|know x% of population) = .8, what is minimum x
min(p1[apply(PfindingFriend,1,max)>.8]) # expect to spot a friend 4 out of 5 days!
## [1] 0.000035
# P(finding a friend|know x% of population) = .8, what is minimum z=x*MaxCrowd
min(p1[apply(PfindingFriend,1,max)>.8])*MaxCrowd # expecting to spot a friend 4 out of 5 days!
## [1] 7

What percentage of the crowd do you need to know to have a 50% chance of spotting someone you know?

# P(finding a friend|know x% of population) = .5, what is minimum x
min(p1[apply(PfindingFriend,1,max)>.5]) # expect to spot a friend 1 out of 2 days!
## [1] 0.000015
# P(finding a friend|know x% of population) = .5, what is minimum z=x*MaxCrowd
min(p1[apply(PfindingFriend,1,max)>.5])*MaxCrowd # expecting to spot a friend 1 out of 2 days!
## [1] 3

What percentage of the crowd do you need to know to have a 25% chance of spotting someone you know?

# P(finding a friend|know x% of population) = .25, what is minimum x
min(p1[apply(PfindingFriend,1,max)>.25]) # expect to spot a friend 1 out of 4 days!
## [1] 0.00001
# P(finding a friend|know x% of population) = .5, what is minimum z=x*MaxCrowd
min(p1[apply(PfindingFriend,1,max)>.25])*MaxCrowd # expecting to spot a friend 1 out of 4 days!
## [1] 2

Now what happens if you don’t cover the same proportion of the crowd?

If you only cover half the distance, how does that affect the minimum number of people you need to know?

ceiling(MF/2) # distance travelled
## [1] 26667
min(p1[apply(PfindingFriend[,1:ceiling(MF/2)],1,max)>.99])
## [1] 0.000175
min(p1[apply(PfindingFriend[,1:ceiling(MF/2)],1,max)>.99])*MaxCrowd
## [1] 35
min(p1[apply(PfindingFriend[,1:ceiling(MF/2)],1,max)>.999])
## [1] 0.000275
min(p1[apply(PfindingFriend[,1:ceiling(MF/2)],1,max)>.999])*MaxCrowd
## [1] 55

If you only cover a quarter of the distance how does that affect the minimum number of people you need to know?

ceiling(MF/4) # distance travelled
## [1] 13334
min(p1[apply(PfindingFriend[,1:ceiling(MF/4)],1,max)>.99])
## [1] 0.00035
min(p1[apply(PfindingFriend[,1:ceiling(MF/4)],1,max)>.99])*MaxCrowd
## [1] 70
min(p1[apply(PfindingFriend[,1:ceiling(MF/4)],1,max)>.999])
## [1] 0.000585
min(p1[apply(PfindingFriend[,1:ceiling(MF/4)],1,max)>.999])*MaxCrowd
## [1] 117

If you only cover a fifth of the distance how does that affect the minimum number of people you need to know?

ceiling(MF/5) # distance travelled
## [1] 10667
min(p1[apply(PfindingFriend[,1:ceiling(MF/5)],1,max)>.99])
## [1] 0.00044
min(p1[apply(PfindingFriend[,1:ceiling(MF/5)],1,max)>.99])*MaxCrowd
## [1] 88
min(p1[apply(PfindingFriend[,1:ceiling(MF/5)],1,max)>.999])
## [1] 0.0008
min(p1[apply(PfindingFriend[,1:ceiling(MF/5)],1,max)>.999])*MaxCrowd
## [1] 160

If you only cover an eight of the distance, how does that affect the minimum number of people you need to know?

ceiling(MF/8) # distance covered
## [1] 6667
min(p1[apply(PfindingFriend[,1:ceiling(MF/8)],1,max)>.99])
## [1] 0.000705
min(p1[apply(PfindingFriend[,1:ceiling(MF/8)],1,max)>.99])*MaxCrowd
## [1] 141
min(p1[apply(PfindingFriend[,1:ceiling(MF/8)],1,max)>.999])
## Warning in min(p1[apply(PfindingFriend[, 1:ceiling(MF/8)], 1, max) >
## 0.999]): no non-missing arguments to min; returning Inf
## [1] Inf
min(p1[apply(PfindingFriend[,1:ceiling(MF/8)],1,max)>.999])*MaxCrowd
## Warning in min(p1[apply(PfindingFriend[, 1:ceiling(MF/8)], 1, max) >
## 0.999]): no non-missing arguments to min; returning Inf
## [1] Inf
# don't reach the point at which we find a friend 99.9% of the time at this distance!


Posted in Eurovision, silly season, Uncategorized

Eurovision 2016: Was Australia Robbed?

Another old Eurovision piece being resurrected for the week that is in it. This one was written with Ben Derrick (my PhD student) and submitted to the Young Statisticians Writing Competition for Significance Magazine (which is jointly published by the Royal Statistical Society and the American Statistical Association). This was our submission.

Every year, the RSS run this competition for early career statisticians to write something for the magazine, more information about this competition can be found here.

Eurovision2016_finalscores

Figure 1: Final Points Won, Eurovision Song Contest 2016 (Australia not to scale)

Eurovision: the drama, the excitement, the statistics. After an engaging climax to the reveal of the votes, the 2016 Eurovision Song Contest in Stockholm was won by Ukraine, with Australia finishing in second place. During the final on May 14th, Eurovision host Petra Mede stated that nothing has changed in the way you vote, it is simply the way they are presented that has changed. What Petra neglected to mention is that the way the winner is calculated has changed.

The organisers introduced a new voting system hoping that it would lead to a more exciting end to the night [1]. The process of revealing the results was tense, but the results were different to what they would have been under the old system.

There were twenty-six finalists of the 2016 Eurovision Song Contest. A total of forty-two countries participated in the voting process. Each country may not vote for itself. Points are allocated 1 – 8, 10 and 12. Each participating country has a televote and a jury vote; equally weighted.

The calculation underpinning the voting system has evolved over time. In the old system used from 2009-2015, these were combined prior to votes being cast; meaning that each country could give points to ten other countries; the televotes were used to break any ties in ranks. In the new system, the results of each jury vote were presented – in the form of the points allocated to the ten countries; and then the combined points of the televoting from all forty-two countries were presented from lowest score to highest score. Overall ties in the final positions were broken by first comparing the number of countries that voted for each of the finalists and then comparing the number of countries who awarded twelve points to the tied countries.

In the new system first used in 2016, the votes were not combined, there was no restriction on countries allocating both sets of points to the same ten countries. If there is a disagreement between the ranks given by the jury and the televotes, a country may allocate points to more than ten countries. To illustrate the two systems, consider Albania’s votes in Table 1 [2].

For ease, TV in Table 1 represents Televote and Pts is an abbreviation for Points.

Table 1: Albania's votes
New Method Old Method
To Country Jury Rank TV Rank Jury Pts TV Pts Pts Given Sum of Ranks Pts Given
Australia (AUS) 1 1 12 12 24 2 12
Italy (ITA) 3 2 8 10 18 5 10
Russia (RUS) 4 4 7 7 14 8 8
Bulgaria (BGR) 7 3 4 8 12 10 7
France (FRA) 2 11 10 10 13 6
Ukraine (UKR) 12 5 6 6 17 5
Spain (ESP) 5 23 6 6 19 4
Poland (POL) 14 6 5 5 20 3
United Kingdom (GBR) 6 18 5 5 20 2
Lithuania (LTU) 20 7 4 4 24 1
Sweden (SWE) 11 8 3 3 24 0
Armenia (ARM) 15 9 2 2 25 0
Israel (ISR) 8 17 3 3 25 0
Hungary (HUN) 10 10 1 1 2 27 0
Malta (MLT) 9 16 2 2 28 0
Austria (AUT) 16 13 29
Azerbaijan (AZE) 13 19 32
Germany (DEU) 18 15 33
Cyprus (CYP) 23 12 35
Latvia (LVA) 17 21 38
Belgium (BEL) 25 14 39
Croatia (HVR) 21 20 41
Czech Rep. (CZE) 22 22 44
Serbia (SRB) 19 26 45
The Netherlands (NLD) 24 24 48
Georgia (GEO) 26 25 51

Albania’s jury and public voters were in agreement about their favourite song – the Australian entry. The jury placed France second (giving them 10 points), but the televoters did not give any points to France (because the French song was ranked 11th in the Albanian televoting process). The televoters ranked Ukraine 5th (thus allocating them six points) whereas the jury ranked the same song 12th – assigning them “null points”. Albania gave points to fifteen different countries.

Under the old system, the sum of the ranks assigned are sorted from smallest to biggest, with the order for tied ranks being decided by the song that received more viewer votes. Under this system, Sweden just misses out on receiving a point because Lithuania received more viewer votes in Albania.

Taking this into account, what would have happened if no changes had been made to the presentation of the preferences of the 42 different countries and the same calculation method used last year had been used again?

Table 2 shows that under the old method the winners would be Australia, followed by the Ukraine, with Russia in third place. The major winner under the new system (other than Ukraine of course) is Poland; moving from what would have been nineteenth place under the old system to eighth place under the new system.

Table 2: New (actual) results against Old results
Rank New calculation (2016) Old Rank Old calculation  (2009-2015) Change in Rank
1 Ukraine 534 1 Australia 333 -1
2 Australia 511 2 Ukraine 288 1
3 Russia 491 3 Russia 242 0
4 Bulgaria 307 4 Bulgaria 187 0
5 Sweden 261 5 France 171 -1
6 France 257 6 Sweden 164 1
7 Armenia 249 7 Armenia 146 0
8 Poland 229 8 Lithuania 108 -1
9 Lithuania 200 9 Belgium 95 -1
10 Belgium 181 10 The Netherlands 81 -1
11 The Netherlands 153 11 Latvia 81 -4
12 Malta 153 12 Austria 73 -1
13 Austria 151 13 Italy 70 -3
14 Israel 135 14 Hungary 63 -5
15 Latvia 132 15 Serbia 61 -3
16 Italy 124 16 Georgia 59 -4
17 Azerbaijan 117 17 Azerbaijan 55 0
18 Serbia 115 18 Cyprus 55 -3
19 Hungary 108 19 Poland 49 11
20 Georgia 104 20 Spain 39 -2
21 Cyprus 96 21 United Kingdom 30 -3
22 Spain 77 22 Israel 28 8
23 Croatia 73 23 Malta 24 11
24 United Kingdom 62 24 Croatia 24 1
25 Czech Republic 41 25 Germany 8 -1
26 Germany 11 26 Czech Republic 2 1

The different results between the two methods can be explained by considering the difference between the jury and telephone votes as illustrated by Table 3.

Table 3: Comparison of Jury and Televote points allocation
Televote points Jury Points Difference in Points
Ukraine 323 211 112
Australia 191 320 -129
Russia 361 130 231
Bulgaria 180 127 53
Sweden 139 122 17
France 109 148 -39
Armenia 134 115 19
Poland 222 7 215
Lithuania 96 104 -8
Belgium 51 130 -79
Malta 16 137 -121
The Netherlands 39 114 -75
Austria 120 31 89
Israel 11 124 -113
Latvia 63 69 -6
Italy 34 90 -56
Azerbaijan 73 44 29
Serbia 80 35 45
Hungary 56 52 4
Georgia 24 80 -56
Cyprus 53 43 10
Spain 10 67 -57
Croatia 33 40 -7
United Kingdom 8 54 -46
Czech Republic 0 41 -41
Germany 10 1 9

There is an apparent wide disparity between the total televote points and the total jury points. Poland received 222 of their 229 points from the televote. The poor performance of the United Kingdom in the televote is in line with previous years, but this was more clearly highlighted on the night by the new method of presenting the results.

The old calculation method allows an entry that is considered average by both the televote and public vote to receive some points, but an entry that is considered very poor by one or the other would be very unlikely to obtain points. The new calculation method allows an entry that is considered to be amongst the poorest by either the jury or the televote to receive substantial points from the other. The pronounced difference between the points allocated by jury and televotes systems to Poland is highlighted in Figure 2.

Eurovision2016_TelevoteVJuryTop8

Figure 2: Top 8 finishers – ordered by final finishing position.

The Australian entry was a solo female singing a moderate tempo ballad. Traditionally this is considered a safe entry and similar entries have done very well in the past. Under the old method every country except for Montenegro would have awarded Australia some points, Ukraine and Russia would have failed to receive points from 5 countries each.

Most of the juries rated Poland very low, but Poland amassed a large total due to the televote, receiving points from every country as illustrated in Figure 2. Under the old method, the televote and jury vote would have been averaged resulting in a more modest score from each country to Poland.

It is surprising to note that Poland have never won Eurovision. With a strong televote secured due to diaspora across Europe, all Poland has to do is provide a song that will also appease the jury vote, and they will certainly be a favourite for victory under this new system.

If the old calculation method were to be applied to the final, it would also be applied to the semi-finals as well. If different countries were to qualify for the final, this would inevitably impact the final voting. The change in voting system did not affect which countries qualified from the semi-finals on this occasion, although it did make some minor differences in the order. Sorry Ireland (and Westlife) fans – you still would not have qualified!

It is difficult to say whether one calculation method is fairer than the other calculation method. The apparent reason behind the reintroduction of the jury vote for use within the old system was to try and nullify the effect of the diaspora and geographical block televote. However, the new method may not be as effective in achieving this goal.

The new method is more transparent, it is clear to see whether points are coming from the jury or the televote. In addition, a country is guaranteed to be rewarded if it is liked by either. Certainly the new format for the voting resulted in a dramatic finale, therefore the producers are likely to favour this method for future contests.

The choice between the old calculation method and the new calculation method highlights the perils of applying rank based approaches. There are many occasions where a group of judges are asked to rank items, but there is no optimum solution for the combination of their ranks. Rank based approaches do not give an indication of the extent of the difference between any two consecutive ranks. In any event, the ranking applied by each judge or individual is fundamentally subjective.

When assessing whether two distributions are equal, the standard test when the observations are paired is the Wilcoxon Rank Sum test. In this example the observations are paired by country. The results of a test on the distribution of the ranks for the old method compared to the distribution of the ranks for the new system, shows that the two distributions for the two methods do not differ (Z = -1.500, p = 0.134). Similarly, a test comparing the distribution of the points awarded by the televote and the points awarded by the juries, shows that the distributions do not differ (Z = -0.546, p = 0.585).

These results are counter-intuitive to the suggestion that the jury and televote opinions show a wide disparity. Therefore the standard test for comparing equality of distributions is not without scrutiny. The mean (and median) rank from the jury is fixed by design to be equal to the mean (and median) rank of the televote. In addition the mean (and median) number of points awarded by both the jury and the televote is also fixed by design. This highlights that the Wilcoxon Rank Sum test is less powerful when the measure of central location are equal for both groups.

In fact, if the televote were to rank the countries in the complete opposite order to the jury vote, the test statistic would result in a p-value of 1.000. This peculiarity could be detected by also calculating the correlation between the two ranks – complete opposite ranks would have a correlation coefficient of -1.

Even with clear instructions as to how to use the ranking system, problems such as those faced by Denmark’s “Juror B” may arise, where she ranked the countries in reverse order in error [3].

This could have been detected by noting the negative correlation between the ranks given by Juror B and those given by the other four Danish jurors. The juror repeated the same procedural error in both the semi-final voting stage and during the final. A simple check using correlations could have detected the problem after the semi-final and allowed a reminder to be given about the correct procedures, without disclosing ranks given by other jury members.

In the final, if Danish Juror B had specified her ranks correctly then Australia should have received 12 rather than 10 points from the Danish jury, whereas Ukraine would have received 0 points from the Danish jury (rather than 12 points). This would have made the final points tally even closer. Under the old method, Australia’s margin of victory would have increased.

The number 13 may also have proved to be unlucky for Australia, this position in the running order meant they performed in the first half of the contest. Ukraine and Russia both received positions in the second half of the running order. All but 4 winners in the 21st century have appeared in the second half of the contest. In fact, Australia beat Ukraine in their semi-final, in which they both performed in the second half.

Historically, analyses of the Eurovision song contest voting focus on predominantly geographical voting blocs. Ukraine is part of the established former Soviet bloc. As relative newcomers to the contest and located outside Europe, Australia are not yet part of an established bloc vote. Eastern Europe and Western Europe appear to be divided over which entry was their favourite, see Figure 3.

Eurovision2016_PointsDiffAusVUkr

Figure 3: Points differential between the points awarded to Ukraine over Australia

Countries in the former Soviet bloc and in closest proximity to Ukraine generally gave more points to the entry from Ukraine than that of Australia. The Scandinavian bloc however was much more favourable to Australia than Ukraine. If Juror B had voted correctly Denmark would have been more obviously part of this bloc.

The Ukrainian entry was considered by some commentators to have a political tone with respect to the Russian and Ukrainian dispute over Crimea, possibly explaining why Russia awarded Ukraine a lower proportion of its total points than usual. However, with its clever staging similar to the 2015 winner, Russia was the pre-contest favourite to win. Political reasons may have encouraged many other countries to vote for Ukraine. This in turn may have further contributed to victory being snatched from Australia.

It appears that everything was conspiring against Australia, but is it fair to conclude that Australia was robbed? Aspects transpiring against Australia can be explained as factors that are to be expected in a subjective competition. Australia can claim to be unfortunate being randomly drawn in the first half of the running order. The new calculation method had been made available well in advance of the contest. Ultimately, the countries that rated Ukraine more favourably than Australia may be down to cultural tastes.

References:

[1] http://www.eurovision.tv/page/voting
[2] http://www.eurovision.tv/page/results
[3] http://www.independent.co.uk/arts-entertainment/tv/news/eurovision-2016-jury-member-gives-completely-the-wrong-points-a7032561.html

Posted in Eurovision, silly season, Uncategorized

Eurovision: mapping out the cliques

Inspired by a student project a few years ago, I started investigating the voting patterns of the Eurovision song contest.  Here is something I wrote just after the 2014 Eurovision Song Contest.

Once again, we have just had the fun and games that goes alongside the Eurovision Song Contest.  An institution started in the 1950’s; it has witnessed the effects of much social and political change.

Year on year, commentators note particular voting patterns [Greece and Cyprus exchanging 12 points if both have made it to the finals], becoming increasingly cynical about the nature of the competition. It is of some interest to discover if it is possible to break through these perceived cliques: will a good enough song win the Eurovision, or do some countries have almost no hope?

To provide some supporting evidence of this clique like behaviour, voting records were obtained from the official Eurovision song contest website.  To simplify the analysis presented here, only results from the finals (so excluding semi-finals) will be presented.  As the voting procedure has changed several times in the history of the contest, the years 2009-2013 were selected.  These years all had semi-final contests to decide which countries precede into the final, and scores were allocated based on an equal weighting of viewer telephone votes and a national judging panel.

The Business of Voting

The procedure for allocation votes have changed multiple times since the conception of Eurovision; notably in 1998 when mass televoting was introduced (only countries without a properly functioning telephone network were permitted to retain the jury system) and in 2009 this was changed to give an equal weighting to audience and jury votes. In 1997 a relegation system based on the performance in the previous five years was introduced, to be replaced with a semi-final in 2004.  In 2008 the current system of two semi-finals was introduced.  Throughout all the change in the last twenty years, one thing has remained constant: the votes themselves (1, 2, 3, 4, 5, 6, 8, 10 and 12 points) that can be given to any other country in the final, which was introduced in 1975. [i]

Basic information about the split between televoting and jury decisions are released after the event, but these are not broken down by country.  Due to the changes in the voting regulations, it is of interest to see if any perceived voting alliances persist within the current voting system, other than the traditional exchange (where possible) of twelve points between Greece and Cyprus.

Social Networks

With the pervasiveness of social media online, the concept of a social network has become familiar to many; to clarify here we use the idea that a social network is “a system of social interactions and relationships”.[ii] Social network analysis has become a way for people to explore how connected their networks of facebook friends are; how quickly trending topics spread on twitter and how to track down culpable groups based on the meta data (not the content) of email exchanges amongst many other (some are even useful) usages of the analysis of social networks.

The simplest form of social network is that like a friendship network on facebook, as represented by Figure 1. In this network, I am directly connected to nodes labelled Paul, Jane and Liz.  Nodes Jane and Liz are connected to one another, but not directly connected to node Paul.  Nodes Jo and Bob are indirectly connected to me through Paul.  In this basic setup, the connections between the nodes allow for travel in both directions – as friendship is a shared experience.

BasicSN


Figure 1: Basic social network

Suppose, instead, that this network represented email traffic, the arrows represent who sent the email and who was at the receiving end of emails.

BasicDSN

Figure 2: A directed social network

Figure 2 is of the same basic structure as Figure 1, but this time information only flows in the direction of the arrows.  So Paul sends me and Jo an email. Jo forwards the email onto Bob.  I forward the email to Jane, who enters into an email exchange with Liz who then responses to me.  Without creating additional connections there is no direct path from Bob to Liz at present.  This explains the basic difference between directed and undirected networks.

Finally, before looking at the Eurovision data, we should think about weighted social networks.  You could imagine a weighting being given based on the number of emails exchanged between people in the network. Figure 2 represents a situation where every connection has equal weight, but this will not allow us to represent the difference between one country giving another a single point versus the all-important “douze points”.

BasicWDSN

Figure 3: A weighted, directed social network

In Figure 3, Paul begins the email chain with two emails to me and Jo.  Both Jo and I send on one of those emails (not necessarily the same one) to Bob and Jane respectively.  Jane and Liz then start a mini conversation about the email (Jane sending a total of three emails to Liz, Liz replies twice) and Liz then sends me a summary of their discussion.  This is a basic example of what is called a weighted, directed social network, visualised as a graph.

Available Data

On the Eurovision website information on the voting records in the song contest finals are available from 1957 onwards.  Due to all the changes in the voting process, we will examine the years 2009-2014. Forty-six different countries participated in the song contest in these six competitions; however Andorra and Czech Republic only voted once (in 2009) and have never made it into the final, so they were excluded from subsequent analysis as not containing sufficient information about ongoing voting patterns.  Bulgaria, Latvia and Slovakia voted in five, six and four years, but have never qualified for the final in the years of interest (2009-2014).

Eurovision as a Social Network

Voting behaviour can be represented as a social network; each country has 10 votes to allocate (1, 2, 3, 4, 5, 6, 8, 10 and 12 points) to any other country with a song in the final.  Votes are not always reciprocated. The votes cast in 2014 are shown in Figure 4.  Arrows represent votes cast from one country to another, the shade indicates how strong a vote it is (darker colour being a higher vote, thus low votes are suppressed in this graph for clarity).  All participating countries, even those who did not succeed in reaching the final, get to vote. Thus there are many countries that can cast votes but not receive any votes.

Eurovision2014votesCropped

Figure 4: Representing the votes of 2014 as a social network

To moderate this problem, instead of looking at a single year we look at the average vote received by each of the countries from each of the other countries and model this as a social network.  This is not as simple as adding up the total give from one country to another and dividing by number of years being examined, as we need to divide by the number of times the receiving country made it to the final of the competition in years that the giving country voted.

By examining the voting data in this way, the focus becomes on systematic behaviour rather than the behaviour in a specific year, which may be determined by the individual song.

An average vote of 0 given by country X to country Y indicates that country X never voted for country Y, while and average vote of 12 indicates that country X [Greece for example] always (where possible) gives 12 points to country Y [Cyprus].  This becomes a problem of analysing a weighted (votes have different points), directed (voting is not always reciprocated) network.

The analysis comprised at evaluating how closely connected the different countries were; solely on the basis of their voting history.

 EurovisionClusters

Figure 5: Three cluster solution

The three distinct voting clusters are clearly geographically based – with a clear cluster of former Yugoslavian countries, another under the influence of Russia, with the remaining cluster representing


[i] http://www.eurovision.tv/

[ii] http://www.oed.com/view/Entry/183739?redirectedFrom=social+network#eid139354802


Posted in Uncategorized

Thoughts on Hamilton (the musical)

I was fortunate enough to manage to obtain tickets to Hamilton in London (long ago, I signed up to a mailing list that gave me early access to tickets).  The original preview period was cancelled as the building works on the theatre were not completed; thus the show I attended was changed to a preview.

Firstly, to avoid chance spoilers, I’d like to make some comments about the theatre itself.  It looks beautiful, but the toilets unfortunately show some signs of the rush to complete.  Poorly signposted, no hot water and missing the simple details such as a hook on the door to hold the door into the Ladies open during the interval queue – instead everyone having to do the limbo to get in or out of the toilets isn’t exactly ideal – and something that could be fixed in 10 minutes with a little thought.

The ticketless ticketing system worked smoothly – people at the door checked your email against your identification and card; the another person swiped your card to automatically print out your ticket.  The unfortunate part of this process is that the resulting ticket isn’t much of a souvenir.

Now that you have decided to read on past the boring bits, onto the parts that could be deemed spoilers.  I won’t go into the plot (you can get a pretty good summary of that on Wikipedia), if you aren’t aware of the songs, try this on Spotify.

By coincidence, my ticket was for Dec 18th, 2017; International Migrants Day. There was a definite cheer for the statement “Immigrants, we get the job done!” during Yorktown – but it’s hard to know if that was explicitly in connection or if it is related to other (political) matters.

Now, onto my thoughts about the show.  It was slick enough that I wouldn’t have considered it a preview – the full “Opening Show” is tomorrow, so I suppose they should have all the kinks worked out by now.  The cast were amazing; my particular favourites were Jason Pennycooke (as LaFayette & Thomas Jefferson) and Michael Jibson as a fabulously camp King George!  Pennycooke really handled Guns & Ships (which I was slightly pensive about prior to the show).

Much has been written about the story, music and lyrics (Lin-Manual Miranda has done an amazing job turning this story into a dynamic musical).  I don’t think that I could honestly add more to those. I really enjoyed the songs, that at this stage, are really familiar to me.

I want to concentrate on the other part of the production – the staging, costume design and the choreography.   The main set looked deceptively simple.  About the only thing that changed during the entire show was the position of some stairs that were on wheels; I have to admit that I was slightly distracted by wanting to double check that they remembered to put on the brakes after moving it into the new position. Smaller props, including tables, benches and boxes for standing on were moved on and off the stage by members of the ensemble (and swings). These flowed as part of the show; hat tip to the choreographer(s) for incorporating these transitions smoothly into the show.  The complex part of the staging was the rotating turntable stage – not the entire stage, but parts of it.  The choreography used this to full advantage and it didn’t feeling like a gimmick; which I thought that it might when I first saw it in action.

One thing that did somewhat surprise me is that how small the cast is!

The costume design team really shone for me.  With some of the cast playing multiple named characters, it was really important that the costumes immediately distinguished between multiple characters.  The changes of costumes also served to highly the different stages of Hamilton’s life; however this is pretty standard for costume design, so while it impressed me, it didn’t surprise me that much.  But how they handled the immediate cues Lafayette/Jefferson; Hercules Mulligan/James Madison; John Laurens/Philip Hamilton and Peggy Schuyler/Maria Reynolds.

I really enjoyed it; it was well worth the trip to London… those who have tickets for a show in the new year, get excited, its great!


Posted in Uncategorized

Self-imposed purdah

I took the decision to avoid writing about opinion polls etc in the run-up to the local elections.  Then the snap election was quickly called, meaning that it’s been several months since I put words on the screen here.  I think that the quality of the opinion polls isn’t that bad, but I think that the pollsters are really struggling to capture the changes in who will turn out.  I am sure that there will be a more formal reflection by the polling companies on this over the next few weeks.

In that time, I’ve been trying to buy a house… which hopefully will be completed in July. Dealing with estate agents etc takes a lot of time!  In other news, I attended Bungay Balls Up this year, as it nicely fell just after the exam period at UWE.  This consisted of a week in a field full of buttercups, glorious sunshine, a trip to the seaside, a dip in a river (wild swimming is great if the water quality is up to it); some G&T’s, a pizza night and generally very little juggling with a lot of socialising with old and new friends.

I’ve also been working with our Equality and Diversity team to try to make the production of statistics and graphs for Athena Swan Self-Assessment Teams a lot more efficient.

And to top it off, I’m involved in a project that means that we will be onsite in Glastonbury next week.  Hopefully I’ll have some interesting stuff from that.  UWE are involved in a number of projects that are trying to improve the long-term environmental impact of the festival; specifically relating to waste management and recycling; processing urine into power and also power management for the production areas (with an aim to reduce the amount of diesel being used onsite to power generators). I’ll be there as a team leader supervising a number of students, none of whom are mathematics or statistics students, but there is definitely room for some in future (but obviously not next year).  The current weather forecast is for a dry Glastonbury. cooling off over the next few days.

Posted in Uncategorized

Hans Rosling

It was announced yesterday that Swedish epidemiologist Hans Rosling died (from cancer). To give you a taster of his performance skills – here is a snippet of his work for “The Joy of Stats” broadcast on BBC4.

A full version of this is on Vimeo:

The Joy of Stats from Gapminder on Vimeo.

Kate Allen at the Financial Times did an interesting piece about him in 2014 – where he spoke of being famous but having limited impact; this piece also told of his successful sale of the software underpinning many of his charts to google, creating a funding source for the Gapminder foundation.

To my surprise, the announcement of his death and peoples responses to it was trending worldwide on twitter.  Thus, considering my last few posts, I thought that it would be fitting to do a quick analysis of what was being said. Looking at tweets between 2017-02-07 14:35:59 UTC and 2017-02-08 10:20:15 UTC.  This required some extra processing as the number of emojis keeps on increasing, and R does not recognise these naturally –  thus requiring an external list of how R encodes each emoji.  This is still not perfect, thus some manual editing of the wordclouds are still needed to remove emojis that are represented as Japanese characters!

hansroslingwordcloud

The sentiments expressed in the tweets were largely positive, and, considering the man in question, suitably full of joy and trust/hope rather than sadness.

The first of these represents the number of tweets that expressed each sentiment [note that a single tweet can express multiple sentiments]

hansroslingsentiment1

While this image represents the strength of the sentiments:

hansroslingsentiment2