Another old Eurovision piece being resurrected for the week that is in it. This one was written with Ben Derrick (my PhD student) and submitted to the Young Statisticians Writing Competition for Significance Magazine (which is jointly published by the Royal Statistical Society and the American Statistical Association). This was our submission.
Every year, the RSS run this competition for early career statisticians to write something for the magazine, more information about this competition can be found here.
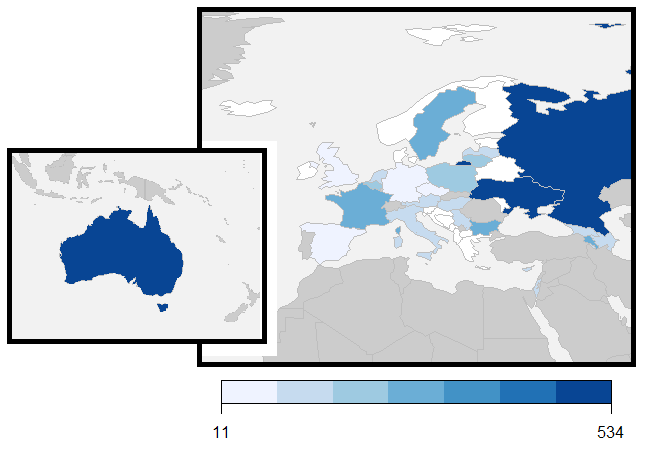
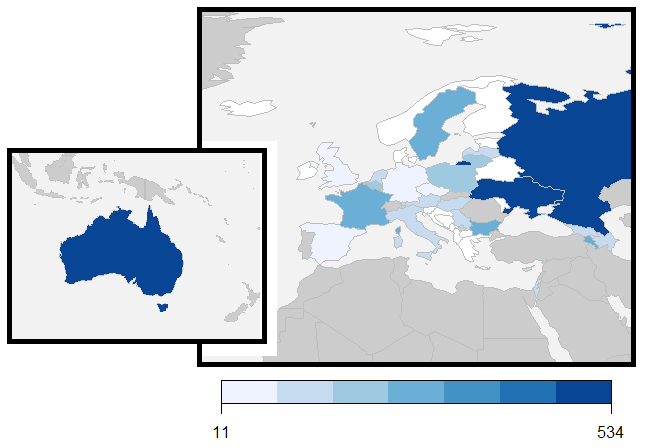
Figure 1: Final Points Won, Eurovision Song Contest 2016 (Australia not to scale)
Eurovision: the drama, the excitement, the statistics. After an engaging climax to the reveal of the votes, the 2016 Eurovision Song Contest in Stockholm was won by Ukraine, with Australia finishing in second place. During the final on May 14th, Eurovision host Petra Mede stated that nothing has changed in the way you vote, it is simply the way they are presented that has changed. What Petra neglected to mention is that the way the winner is calculated has changed.
The organisers introduced a new voting system hoping that it would lead to a more exciting end to the night [1]. The process of revealing the results was tense, but the results were different to what they would have been under the old system.
There were twenty-six finalists of the 2016 Eurovision Song Contest. A total of forty-two countries participated in the voting process. Each country may not vote for itself. Points are allocated 1 – 8, 10 and 12. Each participating country has a televote and a jury vote; equally weighted.
The calculation underpinning the voting system has evolved over time. In the old system used from 2009-2015, these were combined prior to votes being cast; meaning that each country could give points to ten other countries; the televotes were used to break any ties in ranks. In the new system, the results of each jury vote were presented – in the form of the points allocated to the ten countries; and then the combined points of the televoting from all forty-two countries were presented from lowest score to highest score. Overall ties in the final positions were broken by first comparing the number of countries that voted for each of the finalists and then comparing the number of countries who awarded twelve points to the tied countries.
In the new system first used in 2016, the votes were not combined, there was no restriction on countries allocating both sets of points to the same ten countries. If there is a disagreement between the ranks given by the jury and the televotes, a country may allocate points to more than ten countries. To illustrate the two systems, consider Albania’s votes in Table 1 [2].
For ease, TV in Table 1 represents Televote and Pts is an abbreviation for Points.
Table 1: Albania's votes
| New Method | Old Method | ||||||
| To Country | Jury Rank | TV Rank | Jury Pts | TV Pts | Pts Given | Sum of Ranks | Pts Given |
| Australia (AUS) | 1 | 1 | 12 | 12 | 24 | 2 | 12 |
| Italy (ITA) | 3 | 2 | 8 | 10 | 18 | 5 | 10 |
| Russia (RUS) | 4 | 4 | 7 | 7 | 14 | 8 | 8 |
| Bulgaria (BGR) | 7 | 3 | 4 | 8 | 12 | 10 | 7 |
| France (FRA) | 2 | 11 | 10 | 10 | 13 | 6 | |
| Ukraine (UKR) | 12 | 5 | 6 | 6 | 17 | 5 | |
| Spain (ESP) | 5 | 23 | 6 | 6 | 19 | 4 | |
| Poland (POL) | 14 | 6 | 5 | 5 | 20 | 3 | |
| United Kingdom (GBR) | 6 | 18 | 5 | 5 | 20 | 2 | |
| Lithuania (LTU) | 20 | 7 | 4 | 4 | 24 | 1 | |
| Sweden (SWE) | 11 | 8 | 3 | 3 | 24 | 0 | |
| Armenia (ARM) | 15 | 9 | 2 | 2 | 25 | 0 | |
| Israel (ISR) | 8 | 17 | 3 | 3 | 25 | 0 | |
| Hungary (HUN) | 10 | 10 | 1 | 1 | 2 | 27 | 0 |
| Malta (MLT) | 9 | 16 | 2 | 2 | 28 | 0 | |
| Austria (AUT) | 16 | 13 | 29 | ||||
| Azerbaijan (AZE) | 13 | 19 | 32 | ||||
| Germany (DEU) | 18 | 15 | 33 | ||||
| Cyprus (CYP) | 23 | 12 | 35 | ||||
| Latvia (LVA) | 17 | 21 | 38 | ||||
| Belgium (BEL) | 25 | 14 | 39 | ||||
| Croatia (HVR) | 21 | 20 | 41 | ||||
| Czech Rep. (CZE) | 22 | 22 | 44 | ||||
| Serbia (SRB) | 19 | 26 | 45 | ||||
| The Netherlands (NLD) | 24 | 24 | 48 | ||||
| Georgia (GEO) | 26 | 25 | 51 | ||||
Albania’s jury and public voters were in agreement about their favourite song – the Australian entry. The jury placed France second (giving them 10 points), but the televoters did not give any points to France (because the French song was ranked 11th in the Albanian televoting process). The televoters ranked Ukraine 5th (thus allocating them six points) whereas the jury ranked the same song 12th – assigning them “null points”. Albania gave points to fifteen different countries.
Under the old system, the sum of the ranks assigned are sorted from smallest to biggest, with the order for tied ranks being decided by the song that received more viewer votes. Under this system, Sweden just misses out on receiving a point because Lithuania received more viewer votes in Albania.
Taking this into account, what would have happened if no changes had been made to the presentation of the preferences of the 42 different countries and the same calculation method used last year had been used again?
Table 2 shows that under the old method the winners would be Australia, followed by the Ukraine, with Russia in third place. The major winner under the new system (other than Ukraine of course) is Poland; moving from what would have been nineteenth place under the old system to eighth place under the new system.
Table 2: New (actual) results against Old results
| Rank | New calculation (2016) | Old Rank | Old calculation (2009-2015) | Change in Rank | ||
| 1 | Ukraine | 534 | 1 | Australia | 333 | -1 |
| 2 | Australia | 511 | 2 | Ukraine | 288 | 1 |
| 3 | Russia | 491 | 3 | Russia | 242 | 0 |
| 4 | Bulgaria | 307 | 4 | Bulgaria | 187 | 0 |
| 5 | Sweden | 261 | 5 | France | 171 | -1 |
| 6 | France | 257 | 6 | Sweden | 164 | 1 |
| 7 | Armenia | 249 | 7 | Armenia | 146 | 0 |
| 8 | Poland | 229 | 8 | Lithuania | 108 | -1 |
| 9 | Lithuania | 200 | 9 | Belgium | 95 | -1 |
| 10 | Belgium | 181 | 10 | The Netherlands | 81 | -1 |
| 11 | The Netherlands | 153 | 11 | Latvia | 81 | -4 |
| 12 | Malta | 153 | 12 | Austria | 73 | -1 |
| 13 | Austria | 151 | 13 | Italy | 70 | -3 |
| 14 | Israel | 135 | 14 | Hungary | 63 | -5 |
| 15 | Latvia | 132 | 15 | Serbia | 61 | -3 |
| 16 | Italy | 124 | 16 | Georgia | 59 | -4 |
| 17 | Azerbaijan | 117 | 17 | Azerbaijan | 55 | 0 |
| 18 | Serbia | 115 | 18 | Cyprus | 55 | -3 |
| 19 | Hungary | 108 | 19 | Poland | 49 | 11 |
| 20 | Georgia | 104 | 20 | Spain | 39 | -2 |
| 21 | Cyprus | 96 | 21 | United Kingdom | 30 | -3 |
| 22 | Spain | 77 | 22 | Israel | 28 | 8 |
| 23 | Croatia | 73 | 23 | Malta | 24 | 11 |
| 24 | United Kingdom | 62 | 24 | Croatia | 24 | 1 |
| 25 | Czech Republic | 41 | 25 | Germany | 8 | -1 |
| 26 | Germany | 11 | 26 | Czech Republic | 2 | 1 |
The different results between the two methods can be explained by considering the difference between the jury and telephone votes as illustrated by Table 3.
Table 3: Comparison of Jury and Televote points allocation
| Televote points | Jury Points | Difference in Points | |
| Ukraine | 323 | 211 | 112 |
| Australia | 191 | 320 | -129 |
| Russia | 361 | 130 | 231 |
| Bulgaria | 180 | 127 | 53 |
| Sweden | 139 | 122 | 17 |
| France | 109 | 148 | -39 |
| Armenia | 134 | 115 | 19 |
| Poland | 222 | 7 | 215 |
| Lithuania | 96 | 104 | -8 |
| Belgium | 51 | 130 | -79 |
| Malta | 16 | 137 | -121 |
| The Netherlands | 39 | 114 | -75 |
| Austria | 120 | 31 | 89 |
| Israel | 11 | 124 | -113 |
| Latvia | 63 | 69 | -6 |
| Italy | 34 | 90 | -56 |
| Azerbaijan | 73 | 44 | 29 |
| Serbia | 80 | 35 | 45 |
| Hungary | 56 | 52 | 4 |
| Georgia | 24 | 80 | -56 |
| Cyprus | 53 | 43 | 10 |
| Spain | 10 | 67 | -57 |
| Croatia | 33 | 40 | -7 |
| United Kingdom | 8 | 54 | -46 |
| Czech Republic | 0 | 41 | -41 |
| Germany | 10 | 1 | 9 |
There is an apparent wide disparity between the total televote points and the total jury points. Poland received 222 of their 229 points from the televote. The poor performance of the United Kingdom in the televote is in line with previous years, but this was more clearly highlighted on the night by the new method of presenting the results.
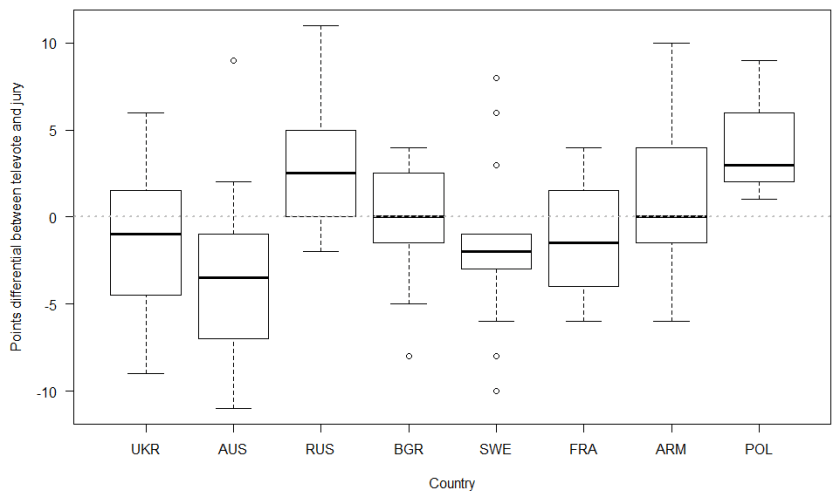
The old calculation method allows an entry that is considered average by both the televote and public vote to receive some points, but an entry that is considered very poor by one or the other would be very unlikely to obtain points. The new calculation method allows an entry that is considered to be amongst the poorest by either the jury or the televote to receive substantial points from the other. The pronounced difference between the points allocated by jury and televotes systems to Poland is highlighted in Figure 2.

Figure 2: Top 8 finishers – ordered by final finishing position.
The Australian entry was a solo female singing a moderate tempo ballad. Traditionally this is considered a safe entry and similar entries have done very well in the past. Under the old method every country except for Montenegro would have awarded Australia some points, Ukraine and Russia would have failed to receive points from 5 countries each.
Most of the juries rated Poland very low, but Poland amassed a large total due to the televote, receiving points from every country as illustrated in Figure 2. Under the old method, the televote and jury vote would have been averaged resulting in a more modest score from each country to Poland.
It is surprising to note that Poland have never won Eurovision. With a strong televote secured due to diaspora across Europe, all Poland has to do is provide a song that will also appease the jury vote, and they will certainly be a favourite for victory under this new system.
If the old calculation method were to be applied to the final, it would also be applied to the semi-finals as well. If different countries were to qualify for the final, this would inevitably impact the final voting. The change in voting system did not affect which countries qualified from the semi-finals on this occasion, although it did make some minor differences in the order. Sorry Ireland (and Westlife) fans – you still would not have qualified!
It is difficult to say whether one calculation method is fairer than the other calculation method. The apparent reason behind the reintroduction of the jury vote for use within the old system was to try and nullify the effect of the diaspora and geographical block televote. However, the new method may not be as effective in achieving this goal.
The new method is more transparent, it is clear to see whether points are coming from the jury or the televote. In addition, a country is guaranteed to be rewarded if it is liked by either. Certainly the new format for the voting resulted in a dramatic finale, therefore the producers are likely to favour this method for future contests.
The choice between the old calculation method and the new calculation method highlights the perils of applying rank based approaches. There are many occasions where a group of judges are asked to rank items, but there is no optimum solution for the combination of their ranks. Rank based approaches do not give an indication of the extent of the difference between any two consecutive ranks. In any event, the ranking applied by each judge or individual is fundamentally subjective.
When assessing whether two distributions are equal, the standard test when the observations are paired is the Wilcoxon Rank Sum test. In this example the observations are paired by country. The results of a test on the distribution of the ranks for the old method compared to the distribution of the ranks for the new system, shows that the two distributions for the two methods do not differ (Z = -1.500, p = 0.134). Similarly, a test comparing the distribution of the points awarded by the televote and the points awarded by the juries, shows that the distributions do not differ (Z = -0.546, p = 0.585).
These results are counter-intuitive to the suggestion that the jury and televote opinions show a wide disparity. Therefore the standard test for comparing equality of distributions is not without scrutiny. The mean (and median) rank from the jury is fixed by design to be equal to the mean (and median) rank of the televote. In addition the mean (and median) number of points awarded by both the jury and the televote is also fixed by design. This highlights that the Wilcoxon Rank Sum test is less powerful when the measure of central location are equal for both groups.
In fact, if the televote were to rank the countries in the complete opposite order to the jury vote, the test statistic would result in a p-value of 1.000. This peculiarity could be detected by also calculating the correlation between the two ranks – complete opposite ranks would have a correlation coefficient of -1.
Even with clear instructions as to how to use the ranking system, problems such as those faced by Denmark’s “Juror B” may arise, where she ranked the countries in reverse order in error [3].
This could have been detected by noting the negative correlation between the ranks given by Juror B and those given by the other four Danish jurors. The juror repeated the same procedural error in both the semi-final voting stage and during the final. A simple check using correlations could have detected the problem after the semi-final and allowed a reminder to be given about the correct procedures, without disclosing ranks given by other jury members.
In the final, if Danish Juror B had specified her ranks correctly then Australia should have received 12 rather than 10 points from the Danish jury, whereas Ukraine would have received 0 points from the Danish jury (rather than 12 points). This would have made the final points tally even closer. Under the old method, Australia’s margin of victory would have increased.
The number 13 may also have proved to be unlucky for Australia, this position in the running order meant they performed in the first half of the contest. Ukraine and Russia both received positions in the second half of the running order. All but 4 winners in the 21st century have appeared in the second half of the contest. In fact, Australia beat Ukraine in their semi-final, in which they both performed in the second half.
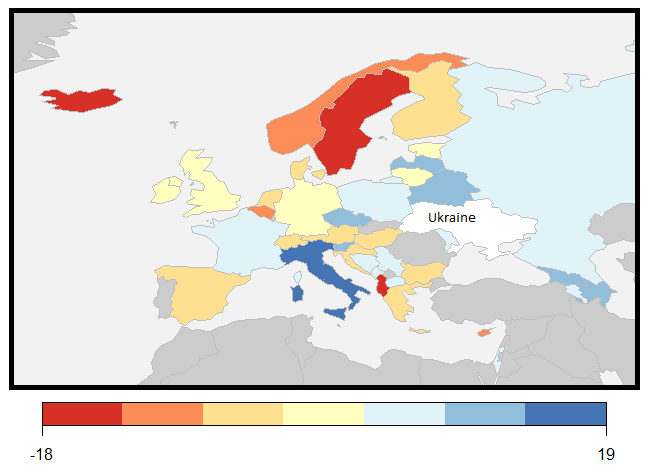
Historically, analyses of the Eurovision song contest voting focus on predominantly geographical voting blocs. Ukraine is part of the established former Soviet bloc. As relative newcomers to the contest and located outside Europe, Australia are not yet part of an established bloc vote. Eastern Europe and Western Europe appear to be divided over which entry was their favourite, see Figure 3.

Figure 3: Points differential between the points awarded to Ukraine over Australia
Countries in the former Soviet bloc and in closest proximity to Ukraine generally gave more points to the entry from Ukraine than that of Australia. The Scandinavian bloc however was much more favourable to Australia than Ukraine. If Juror B had voted correctly Denmark would have been more obviously part of this bloc.
The Ukrainian entry was considered by some commentators to have a political tone with respect to the Russian and Ukrainian dispute over Crimea, possibly explaining why Russia awarded Ukraine a lower proportion of its total points than usual. However, with its clever staging similar to the 2015 winner, Russia was the pre-contest favourite to win. Political reasons may have encouraged many other countries to vote for Ukraine. This in turn may have further contributed to victory being snatched from Australia.
It appears that everything was conspiring against Australia, but is it fair to conclude that Australia was robbed? Aspects transpiring against Australia can be explained as factors that are to be expected in a subjective competition. Australia can claim to be unfortunate being randomly drawn in the first half of the running order. The new calculation method had been made available well in advance of the contest. Ultimately, the countries that rated Ukraine more favourably than Australia may be down to cultural tastes.
References:
[1] http://www.eurovision.tv/page/voting
[2] http://www.eurovision.tv/page/results
[3] http://www.independent.co.uk/arts-entertainment/tv/news/eurovision-2016-jury-member-gives-completely-the-wrong-points-a7032561.html