Hmmm: what’s the fuss about an opinion poll?
The Guardian published an article with the headline “Labour lead falls as Greens hit 20-year high in Guardian/ICM poll”; but can this headline really be supported by the evidence they supply?
According to the footnote at the bottom of the piece: ICM interviewed a random sample of 1,002 adults aged 18+ by telephone on 16–19 January 2015. Interviews were conducted across the country and the results have been weighted to the profile of all adults. ICM is a member of the British Polling Council and abides by its rules.
Why do many national opinion polls use about 1,000 respondents?
The margin of error for support of a party – or how close we expect our sample to be to the true value (which we don’t know), depends on the percentage of people (p) expressing support for a party and the sample size (n) used. More precisely, we use a 95% Confidence Interval (so if we were able to calculate this interval many times, 95% of the time the true level of support would be within these intervals – but in any given interval, we aren’t certain if the true (but unknown) value is actually contained in the interval).
It is:

The closer the value of p is to 50%, then the higher this value will be for any given n. The worst case scenario (in terms of the widest margin of error) occurs at 50%, so let’s examine that case:

The 40% case (which has the same results as the 60% case) is

The 30% case (which has the same results as the 70% case) is

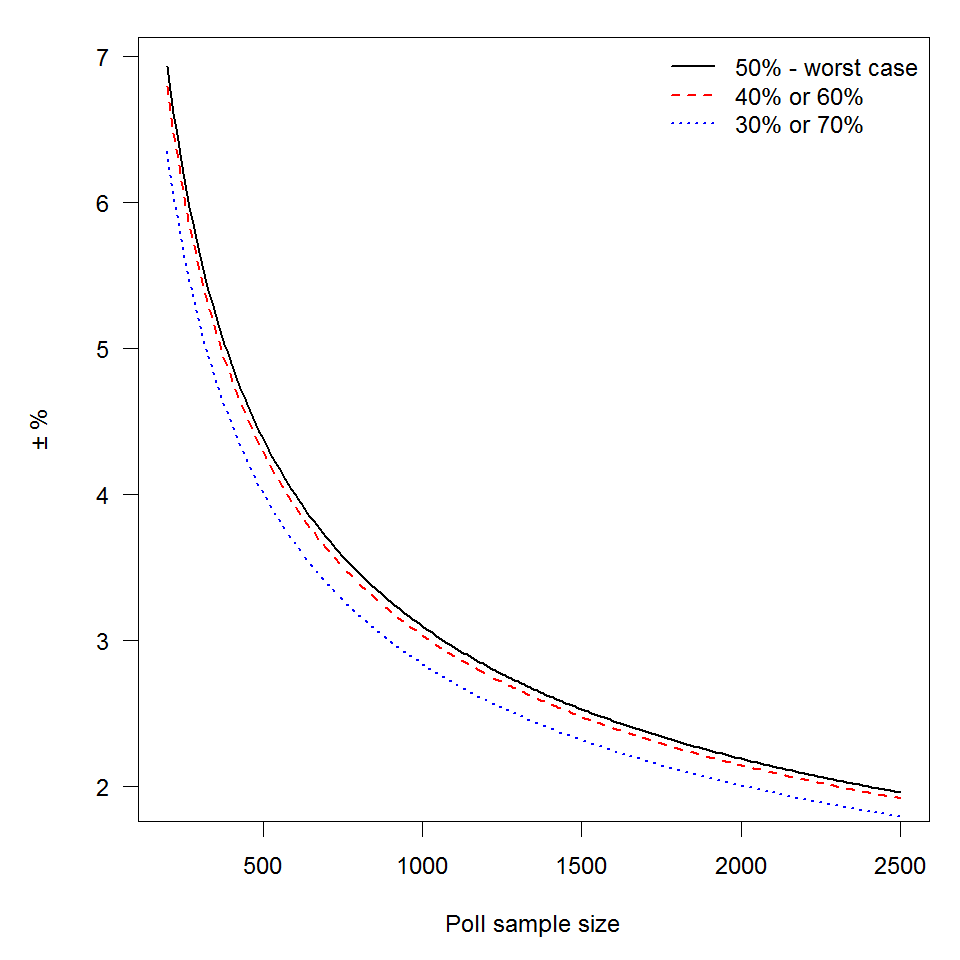
The graph illustrates this quite neatly – the margin of error at a sample size of 500 is 
So, how does all this actually reflect on the current party standings?
The current poll reports the following:
- Labour Party: 33% no change
- Conservative Party: 30% +2
- Liberal Democrats: 11% -3
- United Kingdom Independence Party (UKIP) 11% -3
- Green Party 9% +4
- Other 7% +1
Using the formula introduced above, the 95% confidence intervals for percentage support for each party was calculated and included on the graph below (as dashed lines).
 If ICM have managed to randomly sample from the voting population and appropriately weight the results to match the profile of all adults then the current state of affairs can be viewed as a snapshot of the support at the moment (with some wiggle room as illustrated by the graph above). However, that’s the biggest if of the lot!! Hopefully, I’ll be returning to that issue in the run up to the election in May.
